Студия Infinite Wave организовала вот такой тест программ для ресамплинга (SRC): http://src.infinitewave.ca
Тестируется лишь преобразование 96 -> 44.1 kHz. На графиках показаны частотные характеристики фильтров ресамплинга. Ниже вставляю свой опус по поводу того, на что надо смотреть на графиках.
Вопросы и предложения можно писать сюда или на Mastering Webboard. (Какие программы стоит добавить? Кто может прогнать тест через редкий прибор?)
A couple of words on interpretation of the graphs.
Resampling from 96 kHz to 44.1 kHz conceptually consists of 3 stages:
1. Upsampling of the waveform to 14.1 MHz (a common multiple of 44.1
and 96 kHz) sampling rate by zero insertion.
2. Anti-alias filtering of the upsampled waveform (operating at 14
MHz).
3. Decimation of the waveform.
The performance of a resampling algorithm depends solely on a type of
filter working at stage 2. From the frequency response of the filter
the following information matters for quality (on the example of
WaveLab's graph):
http://audio.rightmark.org/lukin/temp/mwb/WaveLab.png
1. Pass-band flatness in the audible band (we need a zoomed graph to
inspect it). For WaveLab's internal resampler, the pass-band is fair,
with -1 dB at 17 kHz. No significant pass-band ripples.
2. Suppression in the stop-band. It is around -50 dB, and it's
certainly not great. It indicates that we can expect non-linear
distortion of up to -50 dB relatively to the signal (depending on its
frequency). The distortion arises from the fact that spectral images
of the original audio, that will not be suppressed enough, will get
aliased into the target frequency range (0...22kHz).
3. Transition band. Here it reaches 32 kHz, and it means that the
frequency range of 22...32 kHz of the original audio will get aliased
to the 12...22 kHz range of the resulting audio. This is not quite
ultra-sonic yet - another not-so-great thing about WaveLab's internal
resampler.
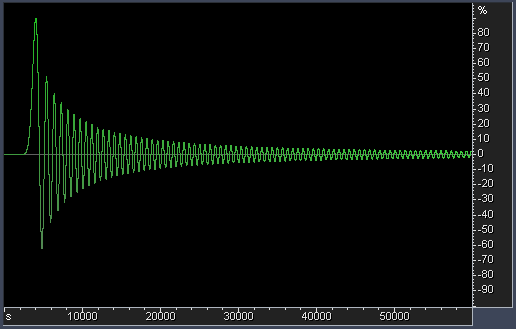
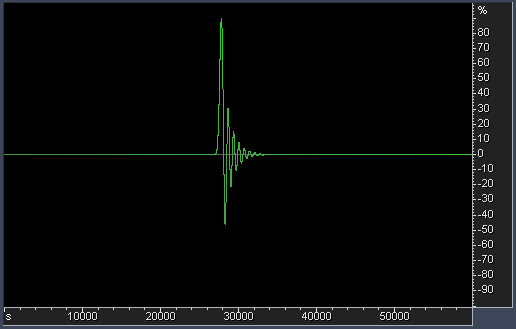
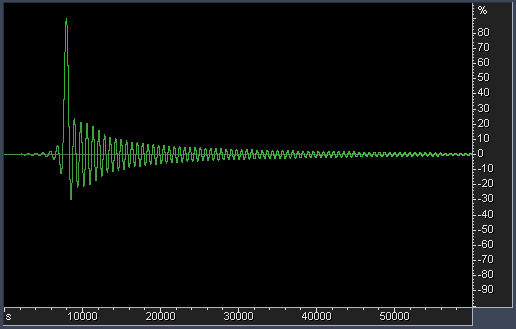
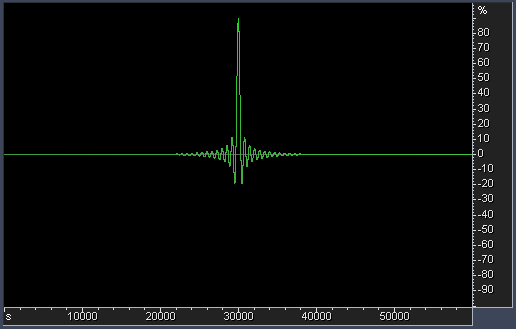
4. Filter's impulse response. It is not graphed yet, but we can
consider making separate graphs for it. The wider is the impulse
response (the more side lobes it has) - the more it spreads transient
energy in time. There are some indications that this effect (also
called "ringing" of a filter) influences the perception of a stereo
image and of bass frequencies in audio (dCS have some good technical
papers on their web-site about effects of filter ringing in high
sampling rate material). The amount of ringing can be estimated from
the steepness of filter's transition band. Steeper transition - alas!
- always produces more ringing. For most filters, ringing is equally
distributed among pre-ringing and post-ringing (linear-phase filters).
Some designs offer a minimal-phase filtering which places all ringing
into post-ringing - a kind of trade-off since post-ringing of
minimal-phase filters is larger than pre- and post-ringing of linear
phase filters.
I hope this helps understanding what tradeoffs are there in resampling
filters. I wonder if this all makes sense from the perception point of
view?
